
 Datama AI skill
AI alone gives you a confident answer. Datama gives you a proof.
Ask a chatbot why margin moved and you get a paragraph. Ask it for a waterfall your CFO can present and things fall apart, generated chart code, different every time. Install the Datama skill in Claude, ChatGPT, Cursor or any Agent Skills host: upload your CSV or XLSX, ask in plain language, and get a ranked list of key factors, mix, price, volume and rate effects, computed by the same deterministic engine as Power BI, Tableau and Excel.
One skill call replaces thousands of tokens of chart code. Same data, same answer, every time.
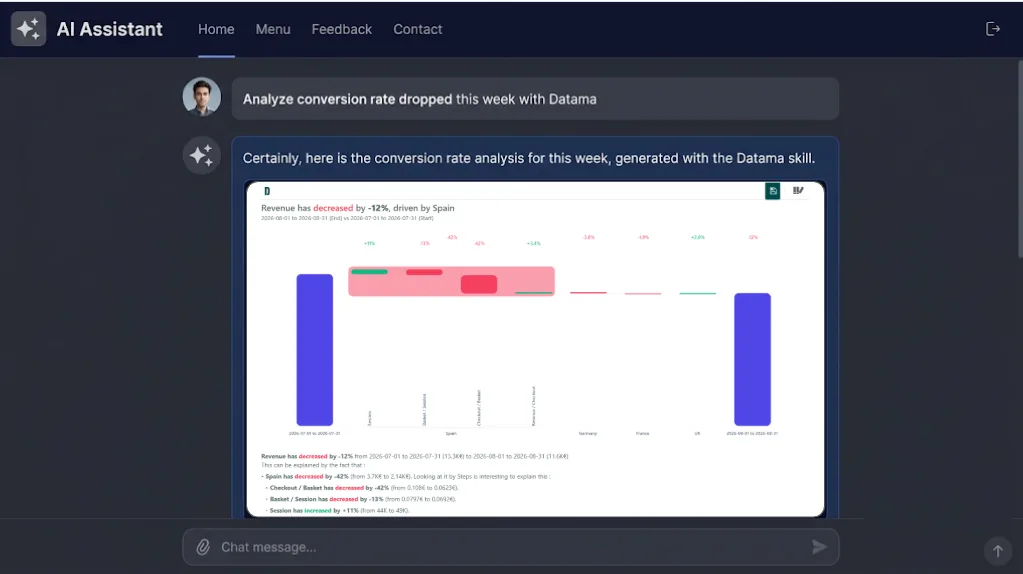
What the skill delivers
Two solutions, one skill package
Compare and Explore, routed automatically from your question.
Compare: explain a delta
Variance decomposition between two periods, segments or budget vs actual: interactive waterfall with ranked drivers (mix, price, volume and rate effects).
Explore: slice your data
Break down a metric by dimension, inspect a funnel step or plot a distribution, without a mandatory A vs B comparison.
Any Agent Skills host
Install datama.zip once in Claude, ChatGPT, Cursor, Copilot or any open-standard assistant, no API pipeline to build.
Standalone HTML, local data
Interactive visualization you can open in any browser: the dataset is inlined in the page, rows are not sent to Datama for rendering.
How it works
From your export to a defensible insight in three steps
Install the Datama AI skill once
Download datama.zip from your Datama account and add it to your assistant, upload in Claude or ChatGPT settings, or drop the folder into Cursor's skills directory. The routing rules, market equation specs and output template ship with the package. No API pipeline to build.
Share your data and ask in plain language
Attach the range you already use for controlling: CSV, XLSX, pasted table or connected sheet. Ask why margin moved, compare budget vs actual or split a variance by entity, product line or region, the assistant stops improvising and calls Datama.
Get a waterfall you can stand behind
Datama Compare or Explore runs the market equation and delivers an interactive HTML page: waterfall, ranked drivers and key points. Not another wall of prose, not 300 lines of generated chart code, a result you can audit, tune and open in any browser.
Why teams pick it
What plain AI cannot give you, and Datama can
Repeatability & standardization
The analysis always follows the same method: auditable, reliable and repeatable. Same data, same breakdown, every run.
Output quality
A chart generated by Claude or a generic agent is not a Datama waterfall: interactive, annotated, board-ready, without multiple rounds of prompting.
Manual fine-tuning
Changing a color or text size in a generative chart often means a new prompt: extra cost and the risk of random regeneration. The Datama library lets you edit those by hand, without regenerating everything.
Portability
Datama charts export to PowerPoint. The generated configuration can be reused as-is in Excel, Looker Studio, Power BI and the other tools Datama integrates with.
Trust
Mix effects, covariance redistribution and other variance-analysis complexity are handled by a dedicated Datama engine. The market equation, described in the skill, structures the analysis, so you can present outputs you stand behind.
Cost & response time
In our internal tests, for a comparable question: up to about 2× fewer tokens thanks to the skill cache, and often a clearly faster answer.
Datama allows us to easily and reliably explain our performance against budget, by displaying only the most significant contributing factors.
Charles Brault
Insights & Analytics Director, TheFork
Trusted by data teams at





















Stop guessing. Start proving.
Download the skill from your Datama account in minutes, or let us walk you through a finance use case.