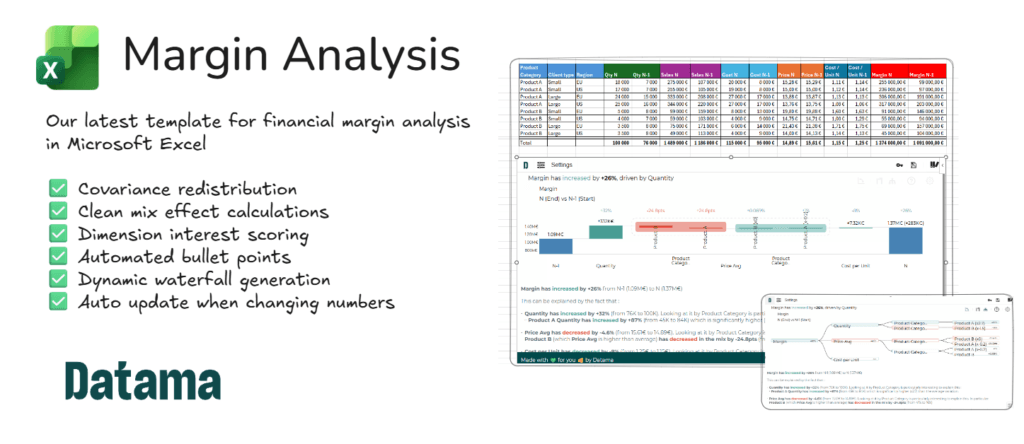
How Finance Teams Are Finally Fixing It in Excel
Every CFO has been there. The monthly close lands, margin is down 1.2 points, and the CEO is already asking: why? The answer is somewhere in a sprawling Excel workbook — nested SUMIFS, hardcoded assumptions, formulas nobody dares touch. And the honest answer is: we think it’s mix. But is it really? How much? Mix of what exactly?
We’ve had this conversation in finance reviews across food retail, travel, and consumer goods. The analysis exists. The confidence in it rarely does.
The Problem: Mix Effects Are Brutally Hard to Get Right
Gross margin variance analysis sounds simple until you’re actually doing it. The right way to think about it is:
Margin = Volume × (Price − Cost per Unit)
That equation hides a lot of complexity. Price and Cost per Unit are themselves averages across your product mix — so when your mix shifts (more low-margin SKUs, fewer high-margin ones), both Price Avg and Cost per Unit move, even if you haven’t changed anything operationally. Mix effects live inside each of these components, which is why isolating them is so hard to do correctly.
In practice, three things go wrong in homemade Excel models:
• The math doesn’t reconcile. The volume, price, and cost effects don’t add up to the total margin delta. There’s always a residual buried in the commentary.
• Mix and rate are blended. Mix effects inside Price and Cost are not isolated. A drop in Price Avg could be a genuine pricing concession, or simply a shift toward cheaper products. The model doesn’t say.
• The model is fragile. Add a new product category or region and the whole thing breaks. Only one person knows how to fix it.
These aren’t cosmetic problems. Misattributing a margin drop to cost inflation when it’s actually a mix shift leads to the wrong corrective action. In businesses where a 1-point margin swing represents millions, that’s expensive.
How Datama Compare Solves It
Datama Compare applies a rigorous decomposition of Margin = Volume × (Price − Cost per Unit) into three clean, additive effects:
• Volume effect: How much of the margin change comes from selling more or fewer units overall?
• Price Avg effect: How much comes from the shift in average selling price — including the mix effect within Price?
• Cost per Unit effect: How much comes from changes in average cost per unit — including the mix effect within Cost?
These three effects sum exactly to your total margin delta. No residual. No footnote.
Refining the equation to your business
The base equation is a starting point. Datama lets you refine it as far as your data allows. If you want to decompose cost further — separating raw material costs from logistics or labour — you simply extend the equation:
Margin = Volume × (Price − Variable Cost − Fixed Cost per Unit)
Each additional step becomes a new effect in the waterfall. The decomposition stays additive and exact regardless of how many levels you add. Finance teams with detailed cost structures — by component, by plant, by route — can push as deep as the data goes.
Going deeper: dimension scoring and mix by segment
Once Datama has attributed the top-level effects, it automatically goes further. For each effect, it:
• Ranks dimensions: Scores every dimension in your dataset (product category, client type, region, channel…) by its explanatory power — so you know where to look first, not last.
• Separates mix from performance: For a given dimension, splits each effect into a mix component (shift in portfolio composition) and a performance component (rate change within each segment). A drop in Price Avg could be 80% mix and 20% actual pricing — Datama tells you which.
• Segment-level contribution: Shows the exact contribution of each segment to the overall effect — which product lines, client types, or geographies are pulling margin up or down, and by how much.
This is where Datama goes beyond a static bridge chart. The CFO gets the waterfall. The controller gets the ranked list of dimensions to investigate. The business partner gets the specific segment that’s underperforming.
Not Just Excel: Datama Works Where Your Team Works
Excel is the natural home for finance teams — and that’s why we built the add-in. But Datama Compare is also available as a Power BI extension, which many CFOs and finance directors already use for executive dashboards. The same decomposition logic, the same waterfall output, embedded directly in your existing Power BI reports.
Whether your finance team works in Excel for deep-dive analysis and Power BI for board reporting, Datama covers both — with consistent methodology across tools.
What It Looks Like in Practice
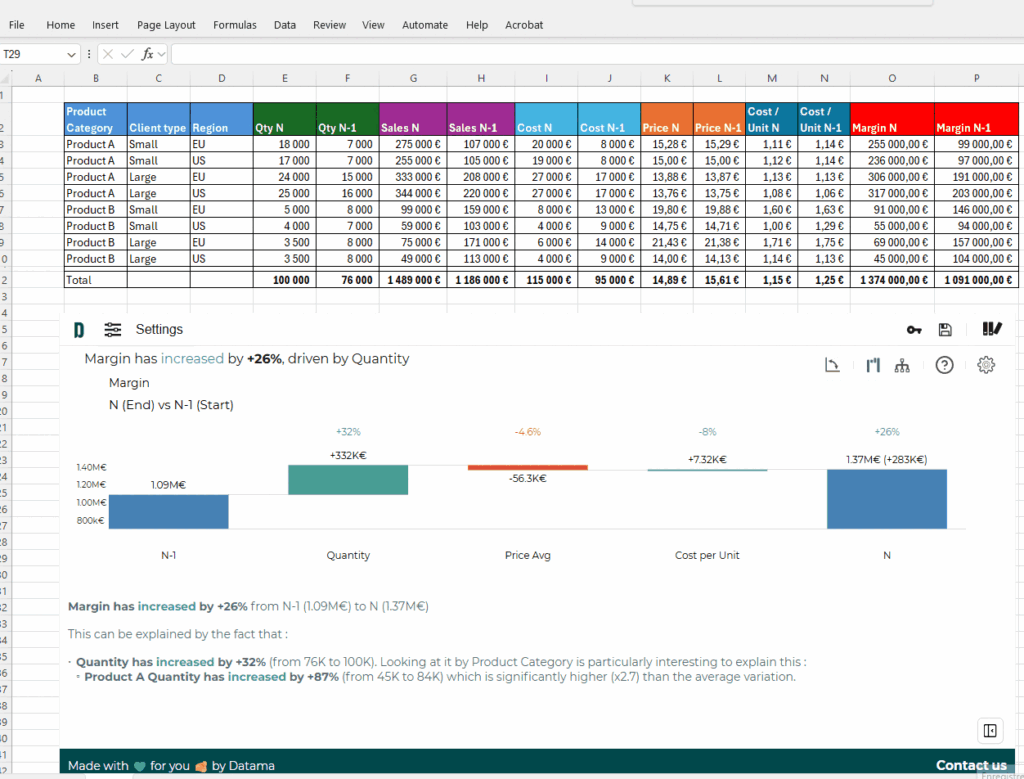
Take a business running weekly margin reviews across product lines and client segments. Overall margin jumps from €1.09M to €1.48M — a €392K increase. The waterfall from Datama Compare, built automatically:
• Volume effect: quantity up 39%, driven by Small client segment doubling
• Price Avg effect: +€2.7K (near-flat — pricing discipline held)
• Cost per Unit effect: −31.2K (cost pressure on Large clients partially offsetting the gain)
Datama then scores the dimensions: Client type explains most of the volume variance. Region explains most of the cost movement. The CFO can present this to the board in 10 minutes. No reconciliation. No residual.
The Template: Ready in 15 Minutes
We built a ready-to-use Excel template pre-configured for this exact equation. You bring your data — the template and add-in handle the decomposition.
Step 1 — Download the Excel template
Available on here. Includes a structured input sheet, a pre-configured Datama Compare setup, and example data.
Step 2 — Install the Datama Excel Add-in
Install from the Microsoft AppSource: Datama Compare on Microsoft AppSource. Free to try.
Once your data is loaded and the add-in active, your first margin bridge is ready in under 15 minutes.
Who This Is For
This template is built for:
• Financial controllers who own the monthly margin reporting pack
• CFOs who need to explain margin variance to the board without going line by line
• FP&A teams tired of maintaining models that only one person understands
If you’re spending more time checking formulas than drawing conclusions — this is for you.
About Datama
Datama is a variance decomposition platform used by finance, product, and analytics teams across retail, travel, and financial services. The Excel Add-in and Power BI extension bring this capability into the tools your finance team already lives in.
→ Download the template: Gumroad
→ Install the add-in: Microsoft AppSource
→ Learn more: datama.io