
Use case #3: Occupancy rate impact on conversion
- Solution
- Datama Compare
- Type
- Ad hoc
- Customer
- Web travel
Category Performance | Solution: Datama Compare | Type : Ad hoc | Client: Web travel | Extension: None
Context
The client is a major hospitality player.
The web product team had an ambitious target of conversion uplift this year vs. previous year. However, by the middle of the year, the target seemed hard to reach. While traffic and average booking value were going up, the drop in conversion was suspected to be related to an issue of hotel availability.
The question is to prove and estimate the impact of occupancy shortage on conversion rate
Approach
Market equation
While first thing would be to check the effect of traffic volume and average booking value on conversion using a classic market equation (see default demo of Datama), we will focus for now on conversion.
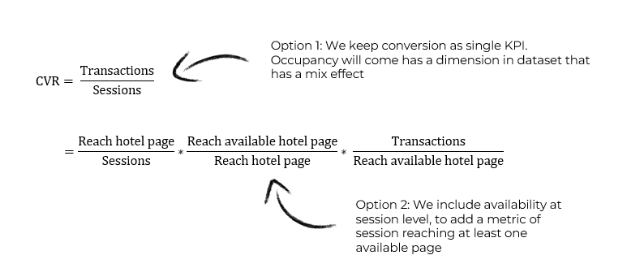
The idea is to split the conversion rate into pieces so that we make the occupancy rate factor appear. However, occupancy rate is generally an offline concept, not directly related to online conversion.
The complexity in occupancy rate or stock analysis in travel is that the occupancy of a given day (the number of rooms available divided by the total number of rooms) is different depending of the booking window, or lead time, ie. the distance between the day of the search and the day of the booking.
Luckily enough, the client has a Custom event in its web analytics tool (Google Analytics) that gives the availability of that hotel (Available/ Partially Available/ Not available) for each hotel page viewed
This market equation is as follows, and we have two options to approach our problem from a dataset standpoint
Dataset
In this use case, the data comes from Google Analytics, stored in Google BigQuery.
From there, we can create SQL logic to classify each session by availability, at session level, so that we don’t duplicate data. There are essentially 4 types of availability for a session: 1/ Not reached = Do not reach a Hotel Page 2/ Not available = Reach only unavailable hotel pages 3/ Partially available = Reach a partially available hotel page, but not fully available 4/ Available = Reach at least one available hotel page
As we also want to be able to break down results and impact by market and device, we will also add these two dimensions. And of course, since we want to understand a drop between two periods, we grab some kind of date dimension.
Once done, we have two options to perform our analysis in Datama.
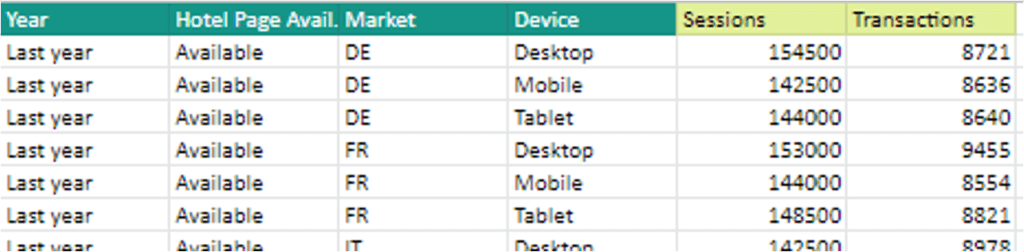
Option 1: Keep the data as is and visualize the impact of availability as a mix effect of availability status on Conversion – see dataset
Option 2: Unpivot data to transform dimensions to metrics by getting one metric for sessions reaching a hotel page, and another for sessions reaching an available hotel page – see dataset
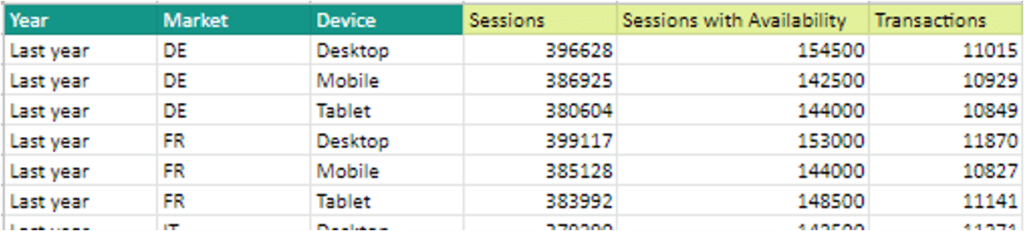
We ingest the data using Datama Prep connector with BigQuery (and unpivot for option 2 can be done there)
Takeaways
Directly in Datama Compare, the analysis allows us to quantify the impact of availability on conversion.
The Option 1 dataset shows a clear mix effect on status availability. The share of sessions reaching only unavailable hotel page results has increased significantly, and they obviously convert really badly, so this has a clear impact on conversion. The advantage of this view is that you can easily communicate the evolution of each type of sessions, including partially available ones, which is a bit of a grey zone in terms of impact.
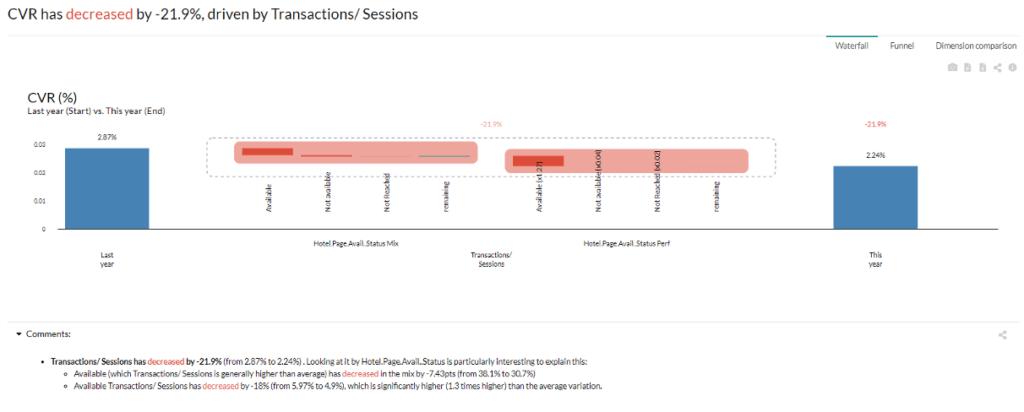
1*:The Datama Compare Waterfall opened on conversion showing a clear mix effect on Availability dimension**
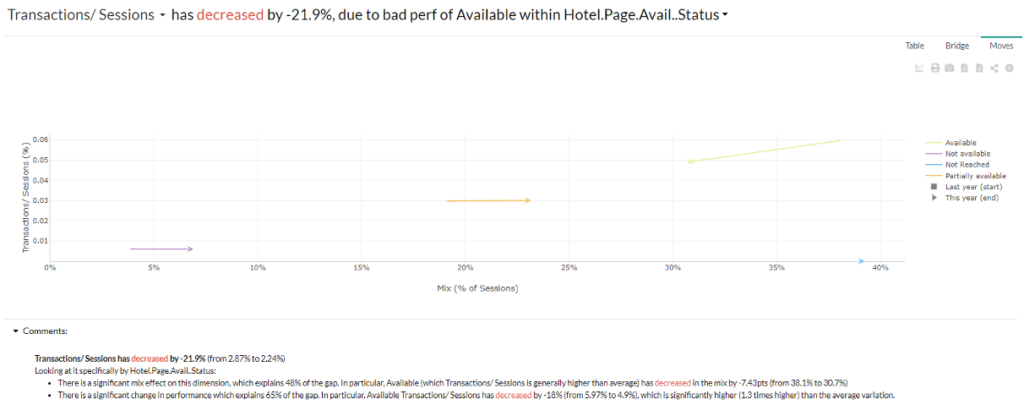
2*: In the Moves slide, we can see available hotels decreasing in the mix and in performance*
The Option 2 dataset allows to visualize the impact through the share of sessions reaching at least 1 fully available hotel page vs. the number of sessions seeing a hotel page. The advantage of this view is that you can then easily split the impact of availability by another dimension, like market or device.
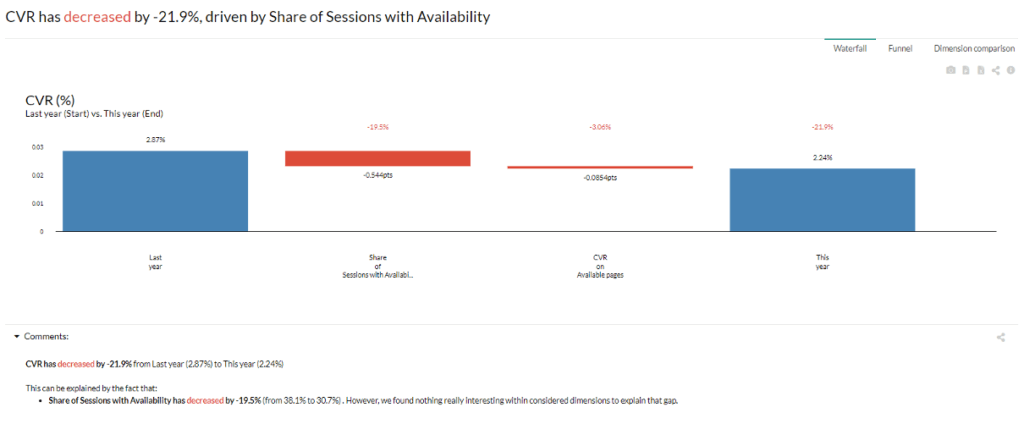
*3: Waterfall having a first step in market equation on Available sessions
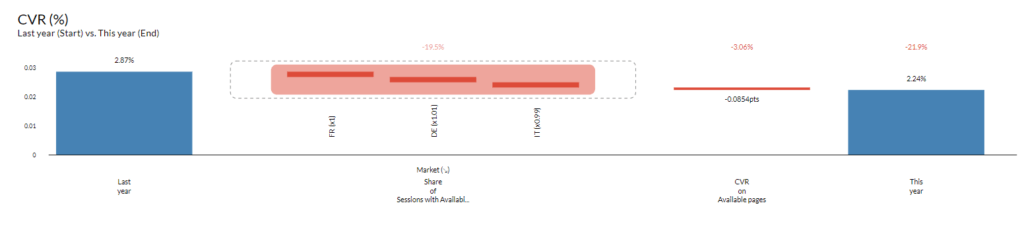
4* With this step you can easily split by other dimension, like market *
In both cases, we see that more than half of the drop in conversion comes from an availability issue.
Outcomes
The learnings have been **shared at C-level and country level, has led to a review of the target of conversion to take into account the limitation of occupancy **and has initiated a large conversation on increasing availability and offer by reducing the stock dedicated to OTAs and building new hotels in the most searched destinations.
Related articles
- Use case
Use case #2: Identifying GA3 vs GA4 data discrepancies
Use case #2: how a major hospitality player systematically identified every discrepancy between GA3 and GA4 on sessions, transactions and revenue.
- Use case
Use case #4: Logistics cost analysis in Tableau
Use case #4: how TechStyle analyses logistics cost variations in Tableau, giving decision makers the drivers behind the numbers far sooner.
- Use case
Use case #9 happn subscription performance
Use case #9: how happn analyses its subscription renewal KPIs in Tableau, replacing manual comparisons with automated driver analysis.
Want the why behind your own numbers?
Try Datama free, or book a 30 minute demo with the team.