
Category management: how to identify the biggest business opportunities
- Category
- Category Management
- Solution
- Datama Compare, Analytical Solution
- Type
- Recurring
- Industry
- all i.e., FMCG, Beauty, Toys
Category management: why reasoning in % change and human bias distort performance reviews, and how to identify the real business opportunities.
The context
At the end of each period, the category managers analyze the performance of their category within their retailer, with a more or less detailed analysis of the competition, and an in-depth analysis of their brands and products.
It takes a lot of time, creates stress, and the quality of the diagnostic varies depending on the level of analysis of the cat man, his business expertise, his available time, the importance of data within the team…
This article focuses on 2 key points that have a strong impact on the quality of the analysis and the confidence that can be had in its performance diagnosis:
- The analyzes are mainly made on the basis of % change
- The human being has a limited capacity for analysis and synthesis
Not quantifying the % of change can lead to wrong conclusions
In 99% of cases, out of habit and lack of an appropriate tool, analyzes are made by only looking at % changes, which can be misleading, for example:
- A small % of evolution on a large mass (volume, value) can have a strong impact on the business
- Conversely, a large % of evolution on a small mass will only have a minimal impact on the business (if this % is strong each period, it is obviously a trend to be followed meticulously)
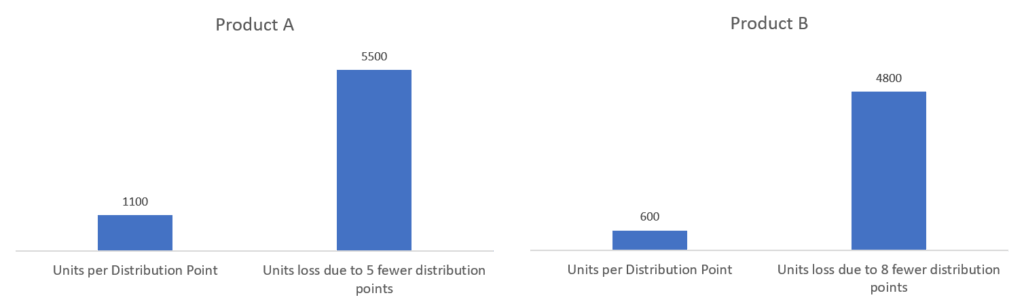
Hence the importance of quantifying the impact of the evolution of explanatory KPIs (WD, price, linear, etc.) on sales value and/or volume (or margin for key accounts).
And this on all business drivers: brands, categories, brands, sub-brands, ranges, formats, up to the sku.
This quantification (or massification) of the % of evolution makes it possible to identify the biggest absolute gains but especially the biggest absolute losses, and therefore to identify the priorities on which to concentrate for a better performance.
Human analytical limitations lead to missed opportunities and threats
In performance analysis, there are many possible approaches:
- A structured end-to-end analysis, which follows the same pattern each period
- An analysis that starts with a familiar pattern but then diverges based on what the data shows
- An analysis without structure, where we focus on the most important % of changes
- An analysis centered on the hypotheses that we make based on our knowledge of the business
Related articles
- Use case
innocent – Monthly monitoring of category performance
How innocent monitors category performance month after month, isolating the levers that move market and brand trends before building action plans.
- Articles
Variance analysis: sales, revenue or margin bridge?
Variance analysis does not stop at the variance: it explains it. Sales, revenue or margin bridge, which method to use depending on the question asked.
- Articles
Price volume mix analysis: the complete guide
How to break down a revenue or margin variance into volume, price and mix effects, with no double counting and no unexplained residual. Formulas, the classic trap, and a method to build an analysis your finance leader…
Want the why behind your own numbers?
Try Datama free, or book a 30 minute demo with the team.