Before diving into the analysis of a website’s performance funnel, an essential step is to optimize the data to conduct more relevant analyses. With the recent migration from Universal Analytics to Google Analytics 4 (GA4), data preparation is more important than ever, as the data has to be configured in a completely different way. However, this presents an opportunity to rethink and improve our data preparation methods.
Two main options are available for GA4 data preparation. The first is to use GA4’s native connector to BigQuery, where you can query your database in SQL and integrate it into your visualization tools, or into Datama. The second option is to use Datama’s native GA4 connector with the Prep solution, which allows you to extract the dataset needed for your analysis in a few clicks.
Datama offers significant added value by facilitating the explanation of your website’s performance variations to make informed decisions and thus improve the efficiency of your website.
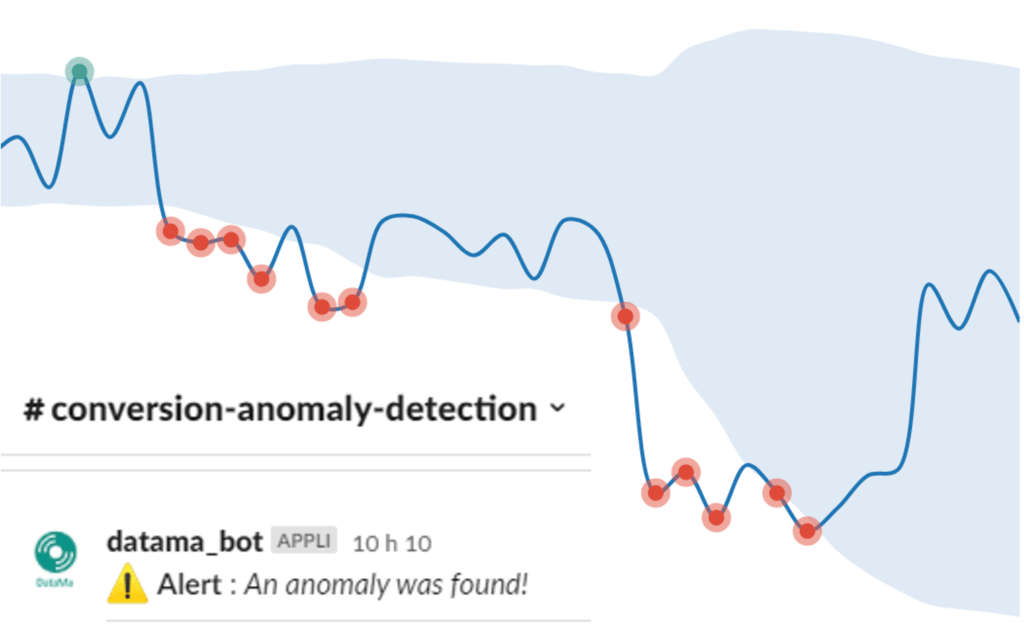
Once configured, you can schedule the frequency of analyses and receive notifications by email or directly in your Slack channels.

Data Preparation in BigQuery
To receive GA4 data in BigQuery, you will need to activate the native connector in your GA4 settings.
Once the data is available in BigQuery, the data is aggregated into a single table, where certain values, such as parameters, are in arrays that you will need to “unnest.” Unnesting decompiles the table so that different values do not appear in a single column, but as several columns for each selected parameter. To have the various fields mentioned above, you can rely on:
- The native GA4 fields such as Sessions and Revenue
- The type of user properties you have defined
MAX(CASE WHEN up.key=’userPropertyName’ THEN COALESCE(up.value.string_value, CAST(up.value.int_value AS STRING),CAST(up.value.float_value AS STRING),CAST(up.value.double_value AS STRING)) END) as userPropertyName - On the parameters of the events (formerly known as custom dimensions in Universal Analytics)
MAX(CASE WHEN ep.key=’eventParameterName’ THEN COALESCE(ep.value.string_value, CAST(ep.value.int_value AS STRING),CAST(ep.value.float_value AS STRING),CAST(ep.value.double_value AS STRING)) END) as eventParameterName
Note: it is important to carefully choose the dimensions that will be useful for the analysis as they can drastically increase the number of rows in your dataset and thus increase the calculation time.
You can then complete your query with this base query:
SELECT
#native GA4 properties
    DATETIME(TIMESTAMP_MICROS(event_timestamp)) as event_timestamp,
    DATE(TIMESTAMP_MICROS(event_timestamp)) as event_date,
    event_name,
device.category as device_category,
    device.language as device_language,
    device.browser as device_browser,
    geo.country as geo_country,
    traffic_source.name as traffic_source_name,
traffic_source.medium as traffic_source_medium,
    traffic_source.source as traffic_source_source,

 #user properties unnest

 MAX(CASE WHEN up.key='userPropertyName' THEN COALESCE(up.value.string_value, CAST(up.value.int_value AS STRING),CAST(up.value.float_value AS STRING),CAST(up.value.double_value AS STRING)) END) as userPropertyName,

 #event parameters unnest

 MAX(CASE WHEN ep.key='eventParameterName' THEN COALESCE(ep.value.string_value, CAST(ep.value.int_value AS STRING),CAST(ep.value.float_value AS STRING),CAST(ep.value.double_value AS STRING)) END) as eventParameterName

FROM

  `ProjectName.analytics_XXXXXXXXX.events_*` ,
   unnest(user_properties) as up,
   unnest(event_params) as ep

WHERE regexp_extract(_table_suffix, r'[0-9]+') BETWEEN format_date('%Y%m%d',date_sub(current_date(), interval 8 day)) #To extract over the 7 last days
AND FORMAT_DATE('%Y%m%d',DATE_SUB(CURRENT_DATE(), INTERVAL 1 DAY))
GROUP BY 1,2,3,4,5,6,7,8,9,10
Note that in this query, the number of variables is not exhaustive; you can add as many variables as you need for your analysis.
To build a dataset for Datama, you will need to create two types of columns:
Dimensions: variables that will allow you to analyze the data under different segments (including fields such as date, an A/B test version, acquisition channel, country, product type, etc.)
Metrics: variables that will allow you to quantify each stage of the funnel. Do not put ratios, but only summable figures
Dimensions are relatively simple, as they are the values of the various fields you prepared in the previous phase; for metrics, it depends on the measurements you want to have:
– Either they will be native to GA4, like Revenue, which will need to be summed to aggregate the data and limit the number of rows in the dataset. Or, you will need to count the number of users/sessions that performed a certain action or reached a certain page
COUNT(DISTINCT user_id) AS Number_Users
– You can also Unpivot a dimension to count the number of occurrences of each of its segments. For example, if a Funnel_Step dimension contains the value of the funnel steps, you can use the PIVOT function to transform a dataset with three columns Date, Funnel_Step, and Number_Users into a dataset with as many columns as there are segments, let’s say we have three steps in the funnel, then we would have the following columns: Date, Step1, Step2, and Step3 with the value of the number of users on each of the steps with the following code:
PIVOT (SUM(Number_Users) FOR Funnel_Step IN (‘Step1’, ‘Step2’, ‘Step3’))
Finally, you will need to choose which the dimensions and metrics that interest you, and you should have a query that looks like:
WITH Table_Unnest_GA4 AS (
SELECT
#native GA4 properties
    DATE(TIMESTAMP_MICROS(event_timestamp)) as event_date,
    device.category,
    device.language as language,
    geo.country as country,
    traffic_source.source as source,

#user properties unnest
    MAX(CASE WHEN up.key='user_id' THEN COALESCE(up.value.string_value, CAST(up.value.int_value AS STRING),CAST(up.value.float_value AS STRING),CAST(up.value.double_value AS STRING)) END) as user_id,

  #event parameters unnest
    MAX(CASE WHEN ep.key='Funnel_Step' THEN COALESCE(ep.value.string_value, CAST(ep.value.int_value AS STRING),CAST(ep.value.float_value AS STRING),CAST(ep.value.double_value AS STRING)) END) as Funnel_Step

FROM `ProjectName.analytics_XXXXXXXXX.events_*` ,
    unnest(user_properties) as up,
    unnest(event_params) as ep

WHERE regexp_extract(_table_suffix, r'[0-9]+') BETWEEN format_date('%Y%m%d',date_sub(current_date(), interval 8 day)) #To extract over the 7 last days
AND FORMAT_DATE('%Y%m%d',DATE_SUB(CURRENT_DATE(), INTERVAL 1 DAY))
GROUP BY 1,2,3,4,5,6,7,8,9,10),

Table_Aggregation AS (
SELECT
    event_date,
    device_category,
    language,
    country,
    source,
    Funnel_Step,
    COUNT(DISTINCT user_id) AS Number_Users
FROM Table_Unnest_GA4
GROUP BY 1,2,3,4,5,6)

SELECT *
FROM Table_Aggregation WHERE
PIVOT(SUM(Number_Users) FOR Funnel_Step IN (‘Step1’, ‘Step2’, ‘Step3’))
This produces the following dataset:
Using the Prep Connector in Datama
For those who don’t want to spend time on SQL queries, doing the same query is possible in a few clicks in Datama. In Datama, create a new use case and click on the GA4 connector to connect your GA4 account.
Note: If you don’t have a Datama account, you can go to app.datama.io/demo to test run the solution. Contact us at (solutions@datama.io) for free access to the solution and to test our GA4 connector.

Next, you can select the property from which you want to extract the data, then choose your dimensions and metrics as you would if constructing your own SQL query. Add filters if needed and choose the date range on which you want to extract the data. There are several optional steps afterwards:
- Clean: to order or rename columns, or add calculated fields
- Pivot: to transform the segments of a column into as many columns as there are segments
- Append: to add other data sources to your GA4 data This will give you a similar schema to the following with more or fewer blocks, depending on your operations:

Then, all you have to do is open the Datama solution you want to use (Compare, Assess, Detect or Pivot)
Conclusion
With the recent migration to GA4, it is essential to familiarize yourself with new tools and techniques to maximize the efficiency of your analyzes. The two approaches above can achieve similar results. Doing it directly via BigQuery will give you much more freedom in your calculations but it requires a certain fluency in SQL. Using Datama Prep is faster and much easier to set up, but you have fewer operations and calculations available than in BigQuery.
You can create your first use case by creating a demo account on our site.


