
Hourly anomaly detection and explanation on GA4 (Google Analytics 4)
Being aware of anomalies happening your website is a constant challenge and any waste of time could cost a lot. Being notified as soon as they happen and getting the explanation for the change can save a tone of money. That's why we've enabled hourly anomaly detection on Datama Detect Getting the data into Datama
To get informed on hourly basis, you need to have data that gets updated at least on hourly basis. Most websites now use Google Analytics 4 for tracking their performance, and Google allows to stream and query the "live" data (updated every 15 minutes) in Big Query.
We've created a Github project that contains a SQL query that allows to make sure you get the previous hours of data, in a format that is compatible with Datama.
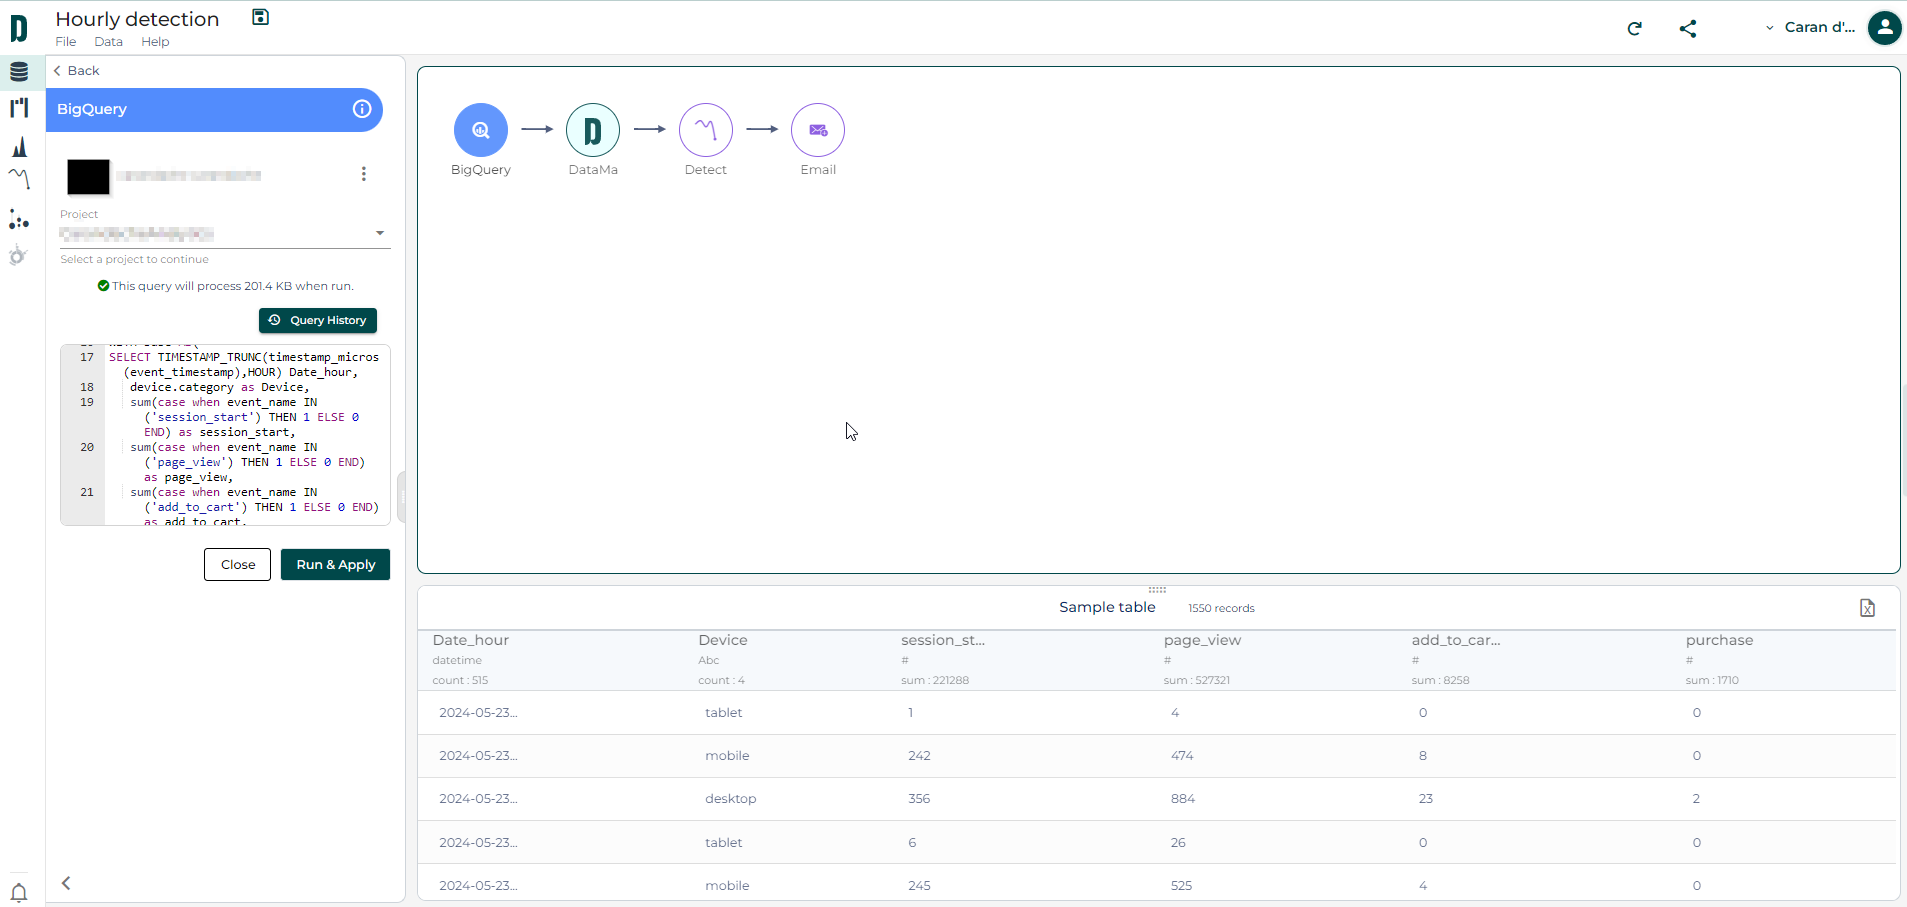
At the end, you should get a data that looks like this table in Big Query, with metrics that will be used to compute the KPIs you want to monitor and Dimensions that will be used to try to explain any anomaly
To connect the data to Datama, you can create a use case and leverage our BigQuery connector , and copy paste your BigQuery query in the "Query" input.
Defining Datama Detect settings and triggering anomalies
Once plugged in Datama, the "Detect" module automatically detects anomalies within the trend, flagged with green / red dots (read more on Datama Detect)
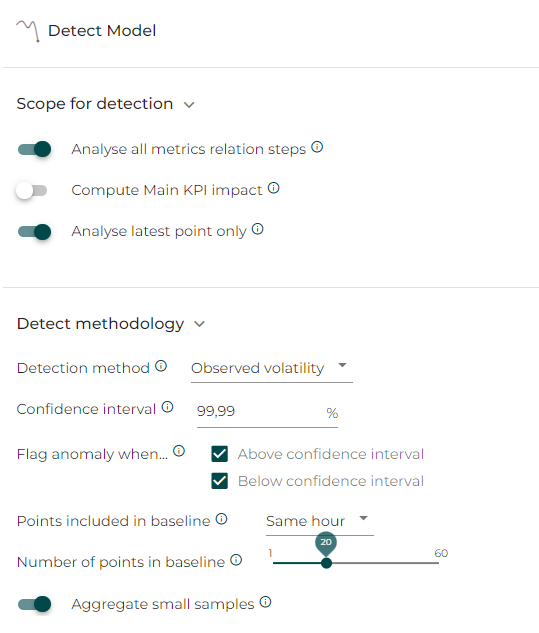
You can refine the settings as follow:
- Make sure to analyse all steps of your market equation at the same time (i.e. all KPIs that are interesting for you – read more on market equation)
- Make sur to analyse latest point only, so that you get notified of anomalies only on the last hour
- Decide of Detection method. Observed volatility is a good option for hourly detection on a website, and you can make sure to include only same hour for baseline calculation if your metrics have a typical daily trend (read more on Detection methods)
- Define confidence interval – relatively high value would avoid to receive too many alerts
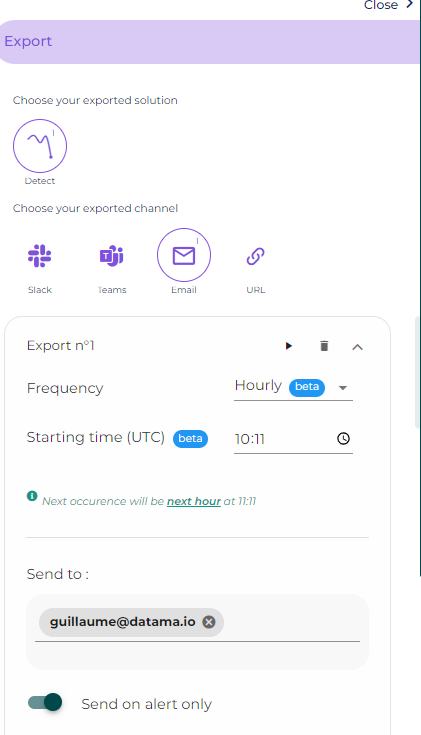
Once you're happy with the settings, paying customers can create the messaging alert in your favorite app: just click on the share button on the top right corner, select your messaging app and schedule a hourly message, sent on alert only
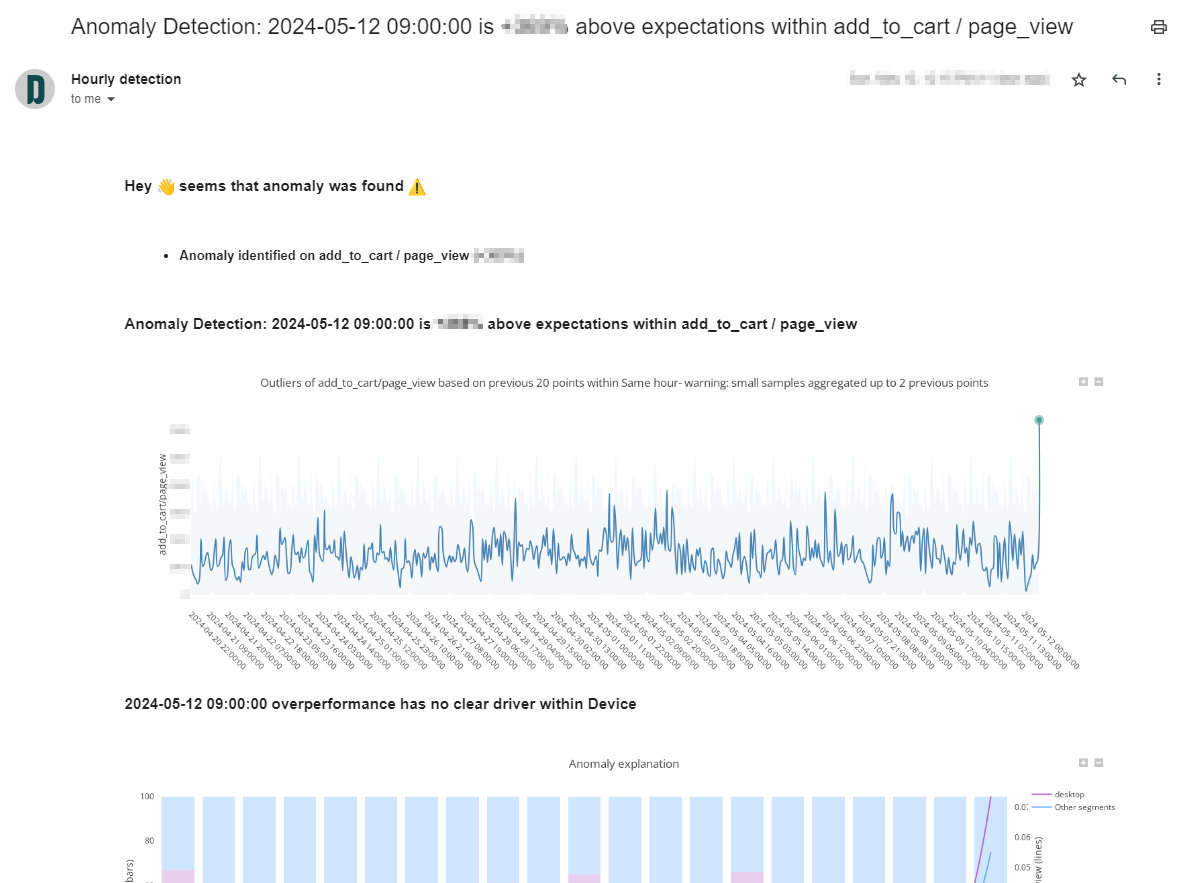
And now just wait for the magic to happen – Datama will send you an email whenever things go off the charts, with an explanation of what happened
Related articles
- Articles
Variance analysis: sales, revenue or margin bridge?
Variance analysis does not stop at the variance: it explains it. Sales, revenue or margin bridge, which method to use depending on the question asked.
- Articles
Price volume mix analysis: the complete guide
How to break down a revenue or margin variance into volume, price and mix effects, with no double counting and no unexplained residual. Formulas, the classic trap, and a method to build an analysis your finance leader…
- Articles
Datama Webinar: Break Down Your Margin Live in Excel with Waterfall & KPI Tree
The step-by-step demo of the Waterfall & KPI Tree add-in that decomposes a margin variance into Volume, Price, Mix and Cost effects directly in Excel, through to a dynamic boardroom presentation.
Want the why behind your own numbers?
Try Datama free, or book a 30 minute demo with the team.